
On safety, technology, and the people we protect.
Posts on workplace safety, the platform, and what we learn from the monitoring centre.
2026-07-23
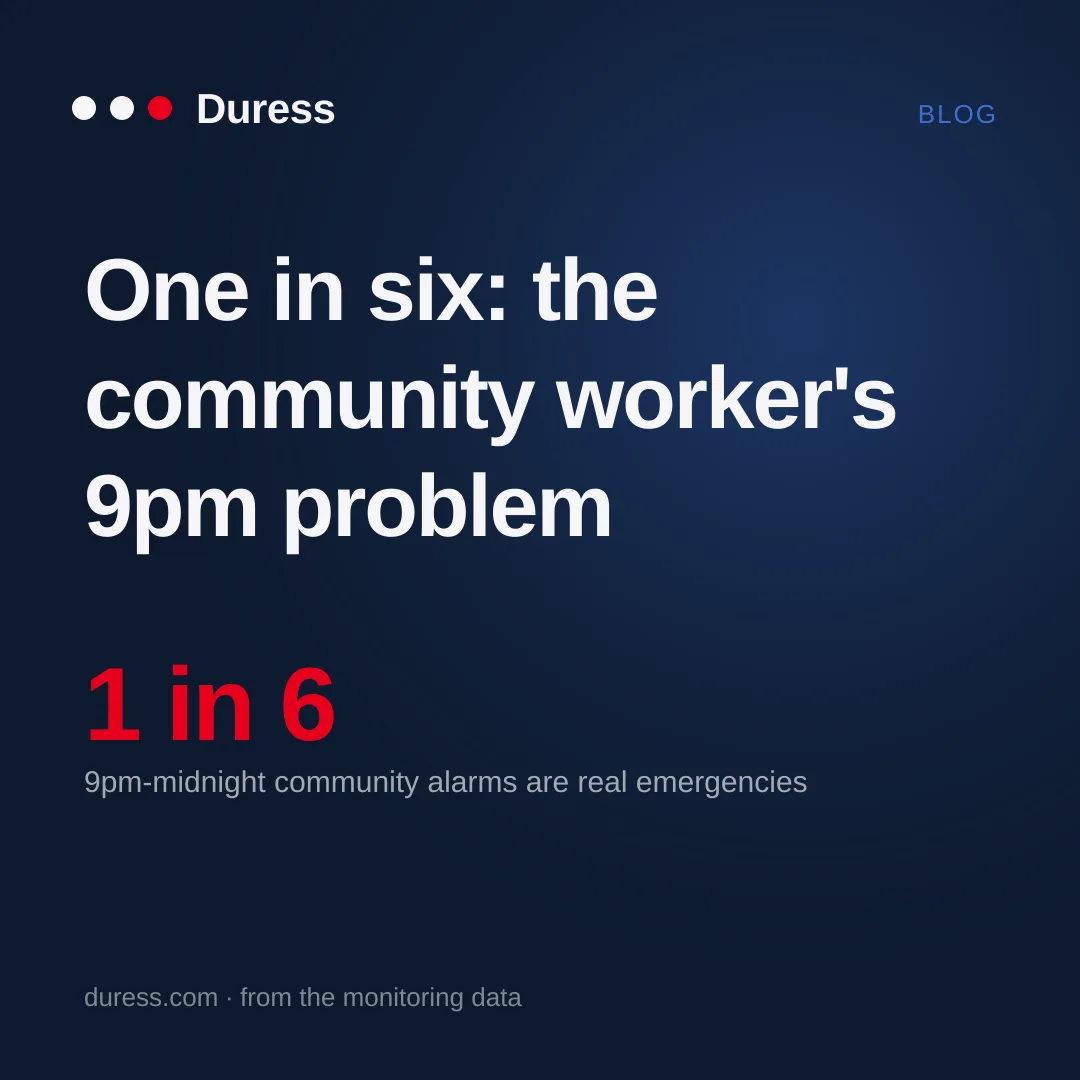
One in six: the community worker's 9pm problem
Between 9pm and midnight, 16.7% of community-sector duress activations are confirmed emergencies. A year of monitoring data on when outreach and support work actually turns dangerous.
Read the post ›
2026-07-23
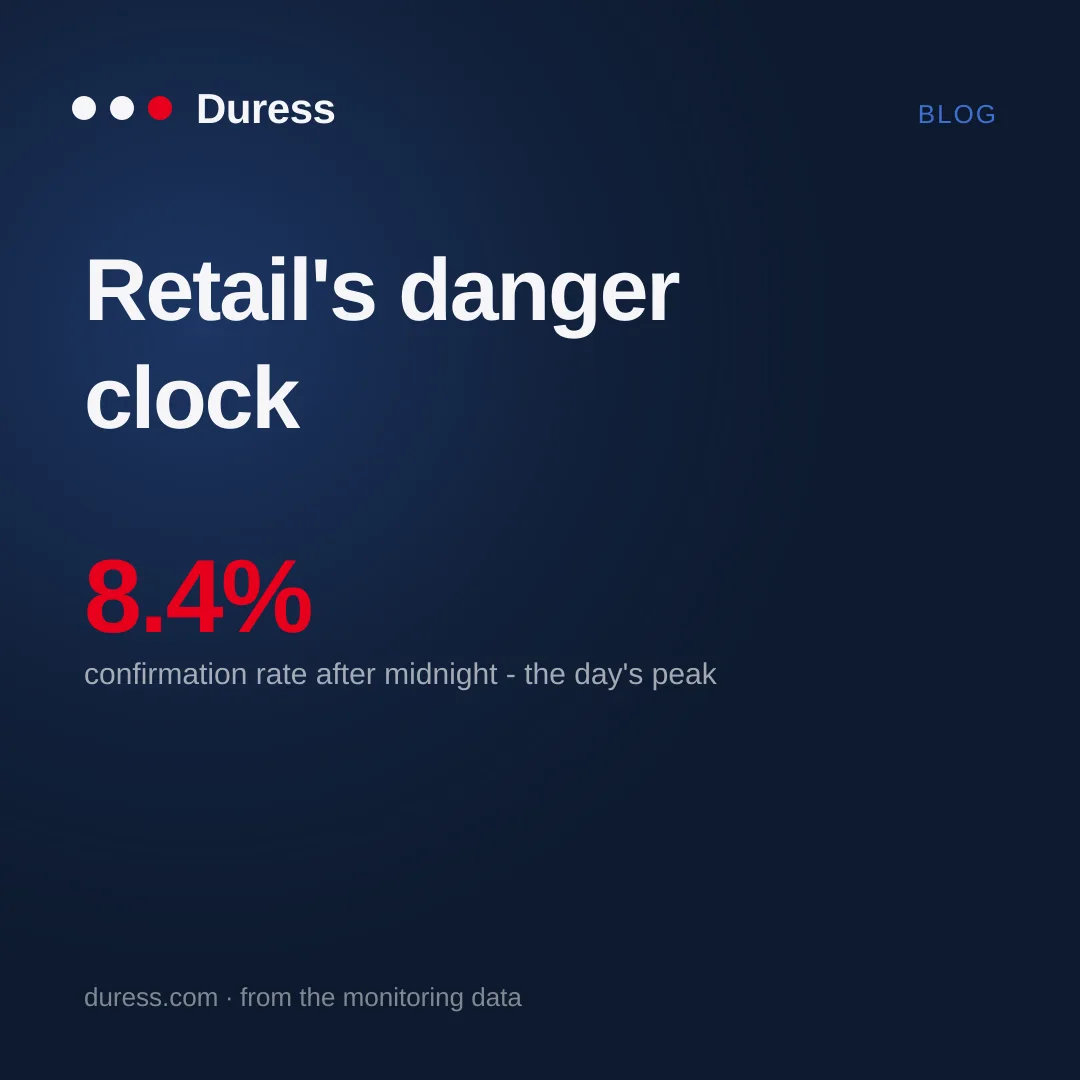
Retail's danger clock
Retail is the largest source of duress activations in our monitoring data, and its risk has a schedule: evening trade and the hours after midnight confirm as real emergencies at more than double the morning rate.
Read the post ›
2026-07-23
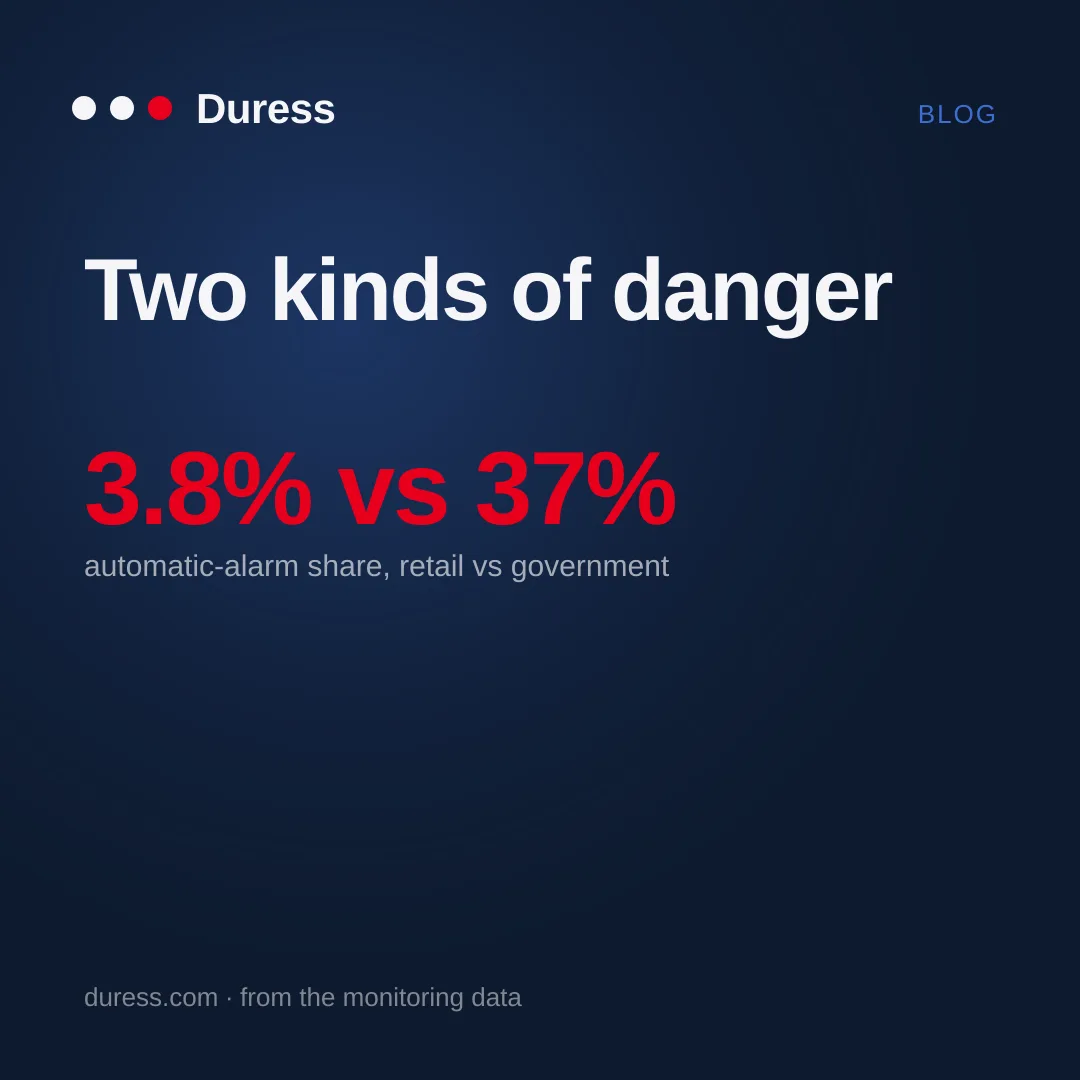
Two kinds of danger
Retail workers press the button; government and community workers set timers. What a year of trigger data says about matching a safety system to the shape of the risk.
Read the post ›
2026-07-23
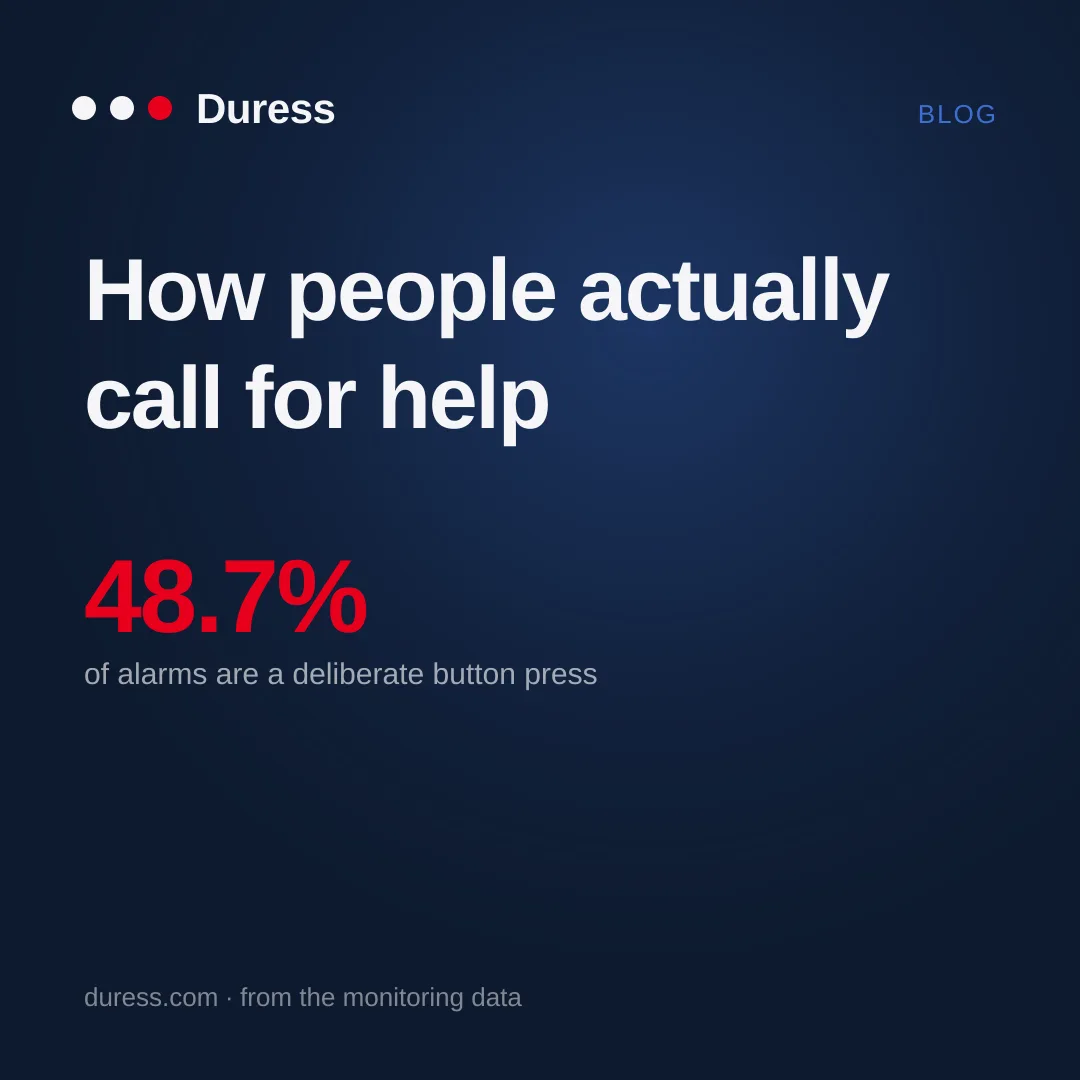
How people actually call for help
Nearly half of duress alarms are a long button press. A tenth are a fall detected. The full breakdown of how 20,433 alarms were raised, and what it means for choosing a device.
Read the post ›
2026-07-23
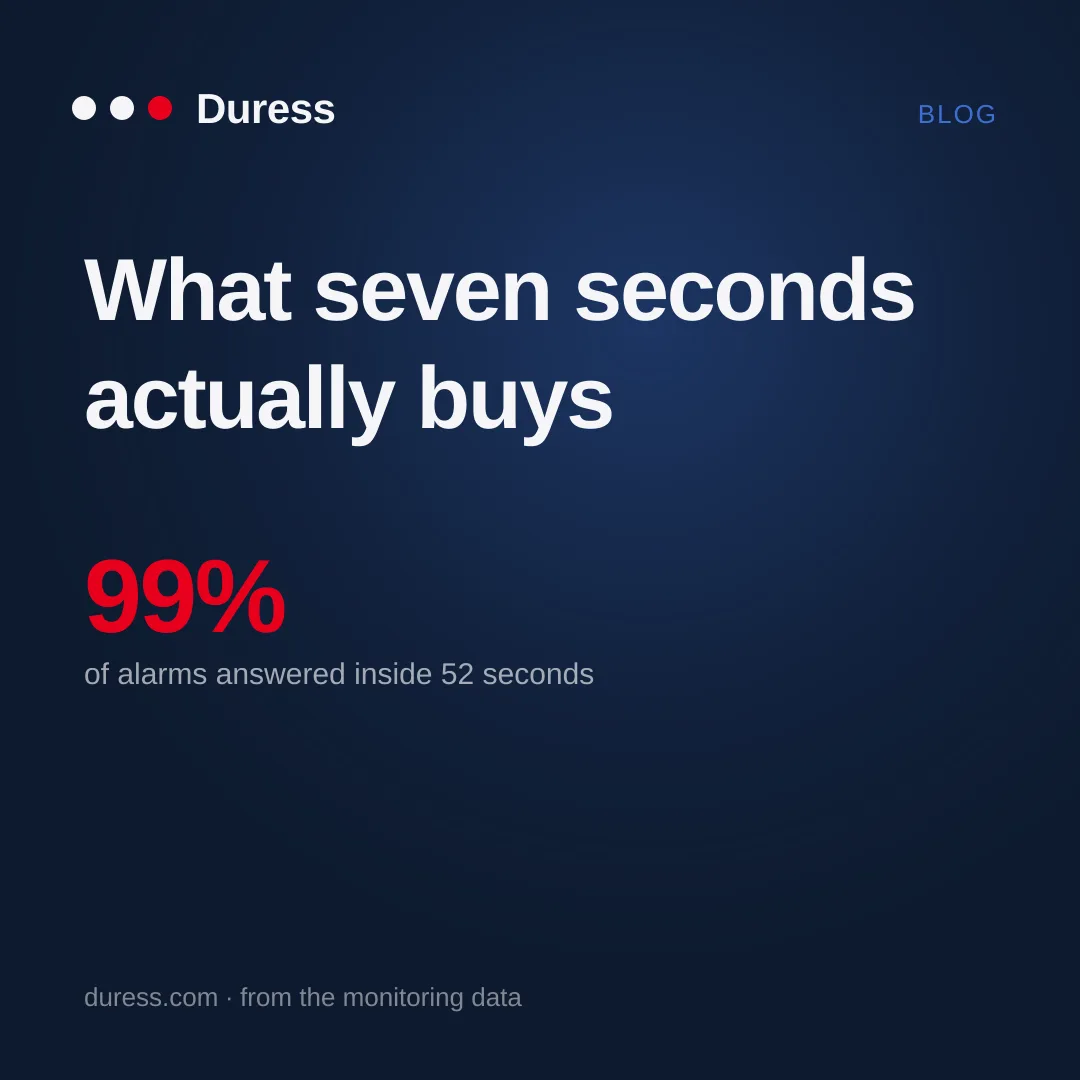
What seven seconds actually buys
A 7-second median operator pickup sounds like a marketing number. Here's what the distribution behind it looks like, and why the tail matters more than the median.
Read the post ›
2026-07-22
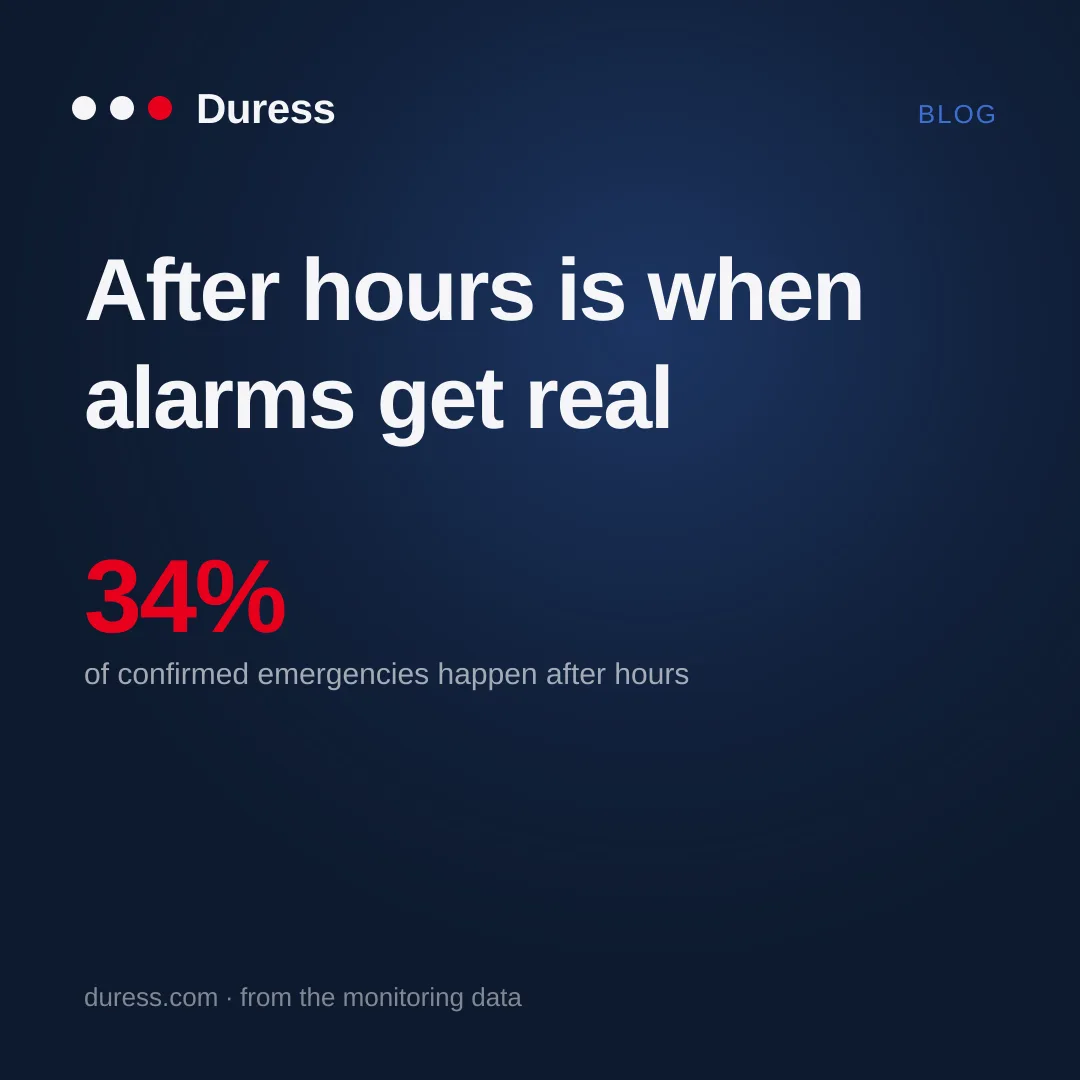
After hours is when alarms get real
22% of duress activations happen between 6pm and 6am, but 34% of confirmed emergencies do. A year of monitoring-centre data on when lone workers actually need help.
Read the post ›
2026-07-22
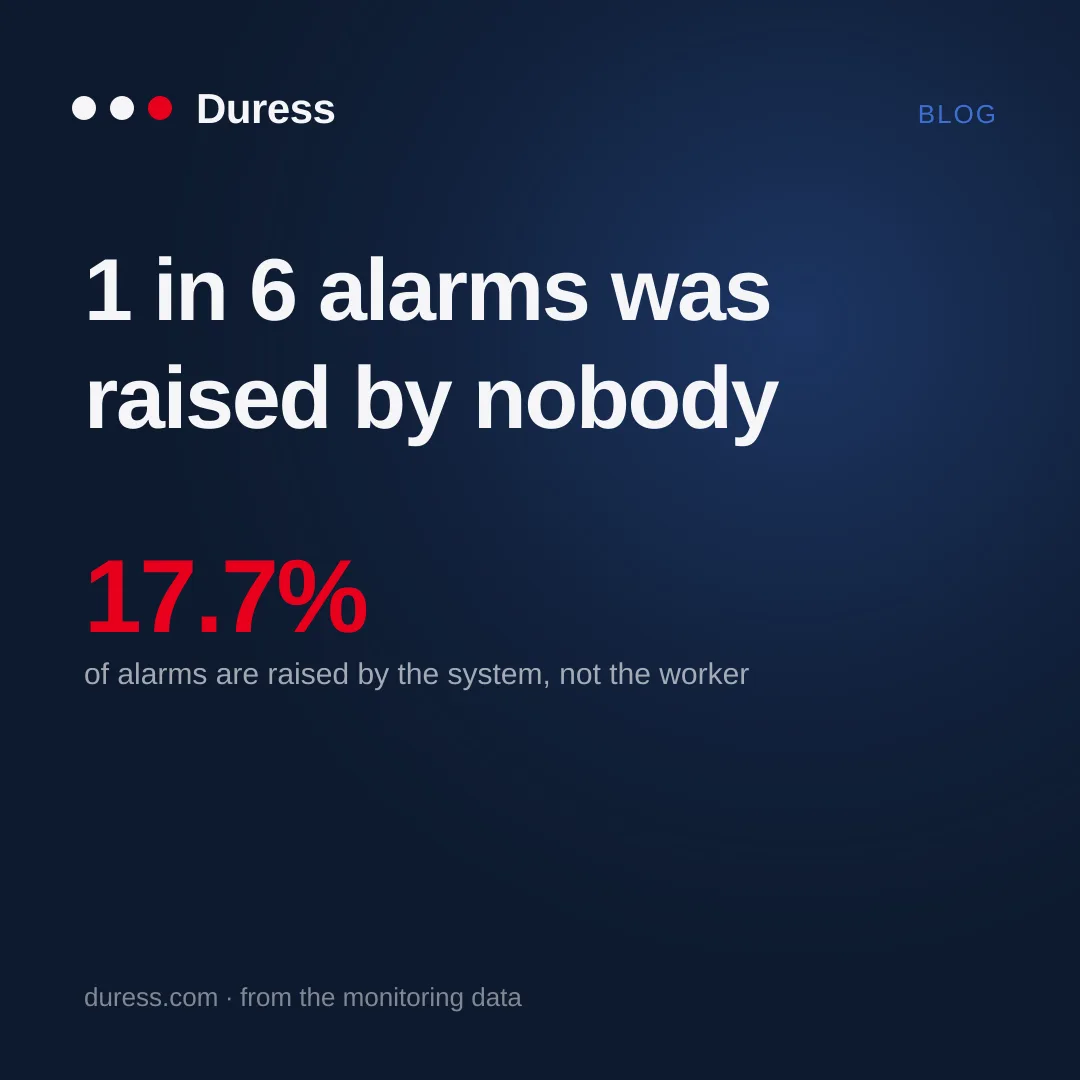
1 in 6 alarms was raised by nobody
17.7% of duress activations in FY26 were automatic: fall detection, missed check-ins and expired safety timers firing when the worker couldn't press anything. What that means for how you design a safety system.
Read the post ›